image credit to Freepik
The Differences In a Nutshell and Where to Invest
- QQQ is More attractive for Day Traders due to Higher Volume
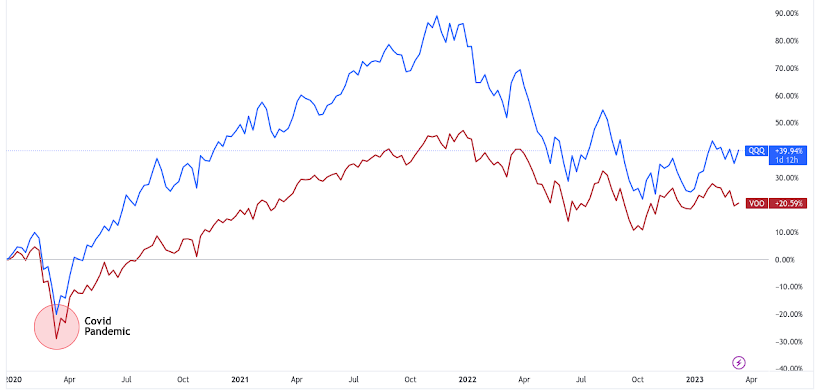
- QQQ yields a Higher Returns Overall
- VOO contains More Assets Under Management
- VOO yields a Higher Average Annual Return
- VOO charges Less Management Fees
- VOO yields a Higher Dividend Yield
- VOO has a Lower P/E Ratio
Description
QQQ - Tracks the NASDAQ 100 Index. The Index includes 100 of the largest domestic and international nonfinancial companies listed on the NASDAQ Stock Market Exchange - Homepage
VOO - Invests in stocks in the Standard & Poor’s 500 Index, composed of the top companies in the S&P 500 Exchange - Homepage
About (QQQ vs VOO)
- Inception: March 10, 1999 vs September 7, 2010
- Managed By: Invesco Capital Managment vs Vanguard Equity Index Group
- Sector: Technology vs Technology
- Region: North America vs North America
- Asset Class: Equity vs Equity
- Asset Class Size: Large Cap vs Large Cap
- Asset Class Style: Growth vs Blend
Key Figures (QQQ vs VOO)
- Volume: 76,171,000 vs 4,798,800
- Average Daily Volume: 57,950,000 vs 3,934,245
- Assets Under Management: $161,739,000,000 vs $774,800,000,000
- Price to Earnings Ratio: 22.7x vs 20.1x
- Annual Dividend Yield: 0.71% vs 1.65%
- Management Fees: 0.20% vs 0.03%
Returns (QQQ vs VOO)
- Average Annual Returns: 5.2% vs 19.1%
- Year to Date (Jan 1, 2023): 12.5% vs 1.9%
- Since Covid (March 10, 2020): 508% vs 71%
- 2 Month (Jan 10, 2023): 7.0% vs 2.4%
- 6 Month (Sep 10, 2022): -0,4% vs -4.8%
- 18 Month (Sep 10, 2021): -18.0% vs -13.5%
- Since Inception: 508.0% vs 260.0%
Growth of $1000 Invested in VOO since Inception (Below)
Growth of $1000 Invested in QQQ since Inception (Above)
Portfolio Composition (QQQ vs VOO)
Top Sectors By Weight (percentage)
- Information Tech: 51.3% vs Information Tech: 27.3%
- Comm. Services: 16.2% vs Healthcare: 14.3%
- Consumer Discr: 15% vs Financials: 11.7%
- MSFT (12.4%), AAPL (12.3%), AMZN (6.2%), NVDA (4.9%), GOOG (3.7%)
- AAPL (6.6%), MSFT (5.56%), AMZN (2.5%), NVDA (1.73%), TSLA (1.65%)
Where to Invest in QQQ or VOO
🇺🇲 I Live in the US - Get a $10 Bonus Here
🇨🇦 I Live in Canada - Get a $5 Bonus or more
Related Comparisons
Investing in the Financial Markets involves Risk and the Potential to Lose Your Entire Investment will Always Exist. Only Invest with Money You Can Afford to Lose.
Which One Would You Invest In? Is There Anything Else You Want to Know? Do You Own These Already?
Let Me Know In The Comments Below
US Crypto Trading is offered via eToro USA. US Securities trading is offered via eToro USA Securities, Inc.(“The BD”), a broker dealer registered with the Securities and Exchange Commission (SEC). The US Broker Dealer is a member of the Financial Industry Regulatory Authority (FINRA) and Securities Investor Protection Corporation (SIPC). eToro USA (NMLS ID: 1769299 ) is not a registered brokerdealer or FINRA member and your cryptocurrency holdings are not FDIC or SIPC insured. [The Investment Gladiators] is not an affiliate of eToro USA Securities, Inc. or eToro USA LLC. [The Investment Gladiators] is compensated if you access certain of the products or services offered by eToro USA LLC and/or eToro USA Securities Inc. Any testimonials contained in this communication may not be representative of the experience of other eToro customers and such testimonials are not guarantees of future performance or success.


Comments
Post a Comment